Councils' Work and Activities in 2020/21

The 2020/21 Annual Report period saw 17 schemes in force nationally, and membership growth to 86,089. Associations' Professional Standards Improvement Program reports were analysed by the Councils informing key insights within this Annual Report. Other activities include case studies below, and the Councils Professional Standards Forums.

Read more about this chapter 
The Professional Standards Authority staff, Celine De Sousa

Professional Standards Schemes

Number of scheme participants over the past 10 years

FY 2010/11
0

As of 30 June 2021, there were 17 schemes in force nationally. The number of occupational association members subject to these schemes has increased over the year from 82,193 to 86,089.

Professional Standard Improvement Program Findings

Accountants

The accounting profession reported a number of improvements throughout the year including:

  • sourcing of professional indemnity insurance data and expert insurance data and information
  • conducting risk analysis with linkage to controls and evidence-supported strategies. New or emerging risks were identified, rated, and controlled
  • one association undertook an external risk review and implemented the risk management recommendations

WA: 4,353

NT: 214

SA: 2,766

QLD: 7,214

NSW: 15,661

ACT: 861

VIC: 12,009

TAS: 532

Lawyers

There were improvements in several areas by solicitors including:

  • alignment with the AS ISO 19600:2015 compliance management system requirements
  • undertaking auditing activities to monitor compliance with the scheme participant’s obligation to disclose their limited liability to consumers
  • one association conducted root cause analysis on claims and complaints data, including an assessment of the actions that could have been taken to prevent the issue. The analysis was used to implement continuing professional development sessions targeting problem areas

WA: 1,934

NT: 0

SA: 1,600

QLD: 6,387

NSW: 16,138

ACT: 0

VIC: 5.187

TAS: 0

Barristers

Noticeable improvements were observed across several bar associations including:

  • undertaking auditing activities to monitor compliance with the scheme participant’s obligation to disclose their limited liability to consumers
  • one association conducted their first annual continuing professional development audit
  • two associations responded to risks of sexual harassment by providing specialised training for complaint handlers

WA: 261

NT: 0

SA: 211

QLD: 988

NSW: 2,232

ACT: 0

VIC: 1,346

TAS: 0

Built Environment

Some of the highest performing areas for the built environment sector included:

  • informing and educating scheme participants of their compliance obligations under the professional standards legislation and scheme
  • compliance with the Annual Membership Assurance Report verifying the number of scheme participants for the annual fee period
  • one association provided in-depth analysis of their comprehensive professional indemnity insurance claims data. The association used the insights to inform risk management strategies

WA: 345

NT: 28

SA: 230

QLD: 785

NSW: 1,462

ACT: 172

VIC: 1,066

TAS: 67

Common Topics

Common areas of achievement

  • Requirements to disclose the scheme by member participants
  • Professional indemnity insurance standards
  • Compliance planning

Common areas for improvement

  • Discretionary caps and exemptions
  • Complaints and discipline systems improvements and root cause analysis
  • Scheme monitoring improvements

Professional Standard Improvement Program

100% of Professional Standards Improvement Program reports provided on time by regulated associations.100% of Professional Standards Improvement Program reports provided on time by regulated associations.
41% of associations reported a hardening in the Professional Indemnity Insurance market.41% of associations reported a hardening in the Professional Indemnity Insurance market.
30 claims exceeding 50% of the monetary ceiling in 2019, 13 claims exceeding 50% of the monetary ceiling in 202030 claims exceeding 50% of the monetary ceiling in 2019, 13 claims exceeding 50% of the monetary ceiling in 2020
Causes
  1. Negligence – Communication / advice / administration
  2. Misappropriation, misleading and deceptive
  3. Lack of skill and competence
51% in 2019 and 71% in 2020 - Regulated associations that implemented Root Cause Analysis, 83% of these associations incorporated elements of Root Cause Analysis into risk management strategies during 2020. 51% in 2019 and 71% in 2020 - Regulated associations that implemented Root Cause Analysis, 83% of these associations incorporated elements of Root Cause Analysis into risk management strategies during 2020.

Root cause analysis as a risk management tool

To encourage and assist associations, the Councils have provided guidance to incorporate root cause analysis into their risk management strategies.

  1. Identify trends from data
  2. Implement root cause analysis using data sources
  3. Formulate risk management responses that target the identified root causes
  4. Monitor data and evaluate risk management strategies

Case Studies

Forums Continued to Build the Professional Standards Community

The Councils delivered two Professional Standards Forums in the reporting period, to continue engagement with occupational associations and deliver encouragement and assistance for the development of associations’ self-regulatory capacity.

The Professional Standards Councils’ Chair, John Vines OAM presents at the October 2020 Professional Standards Forum
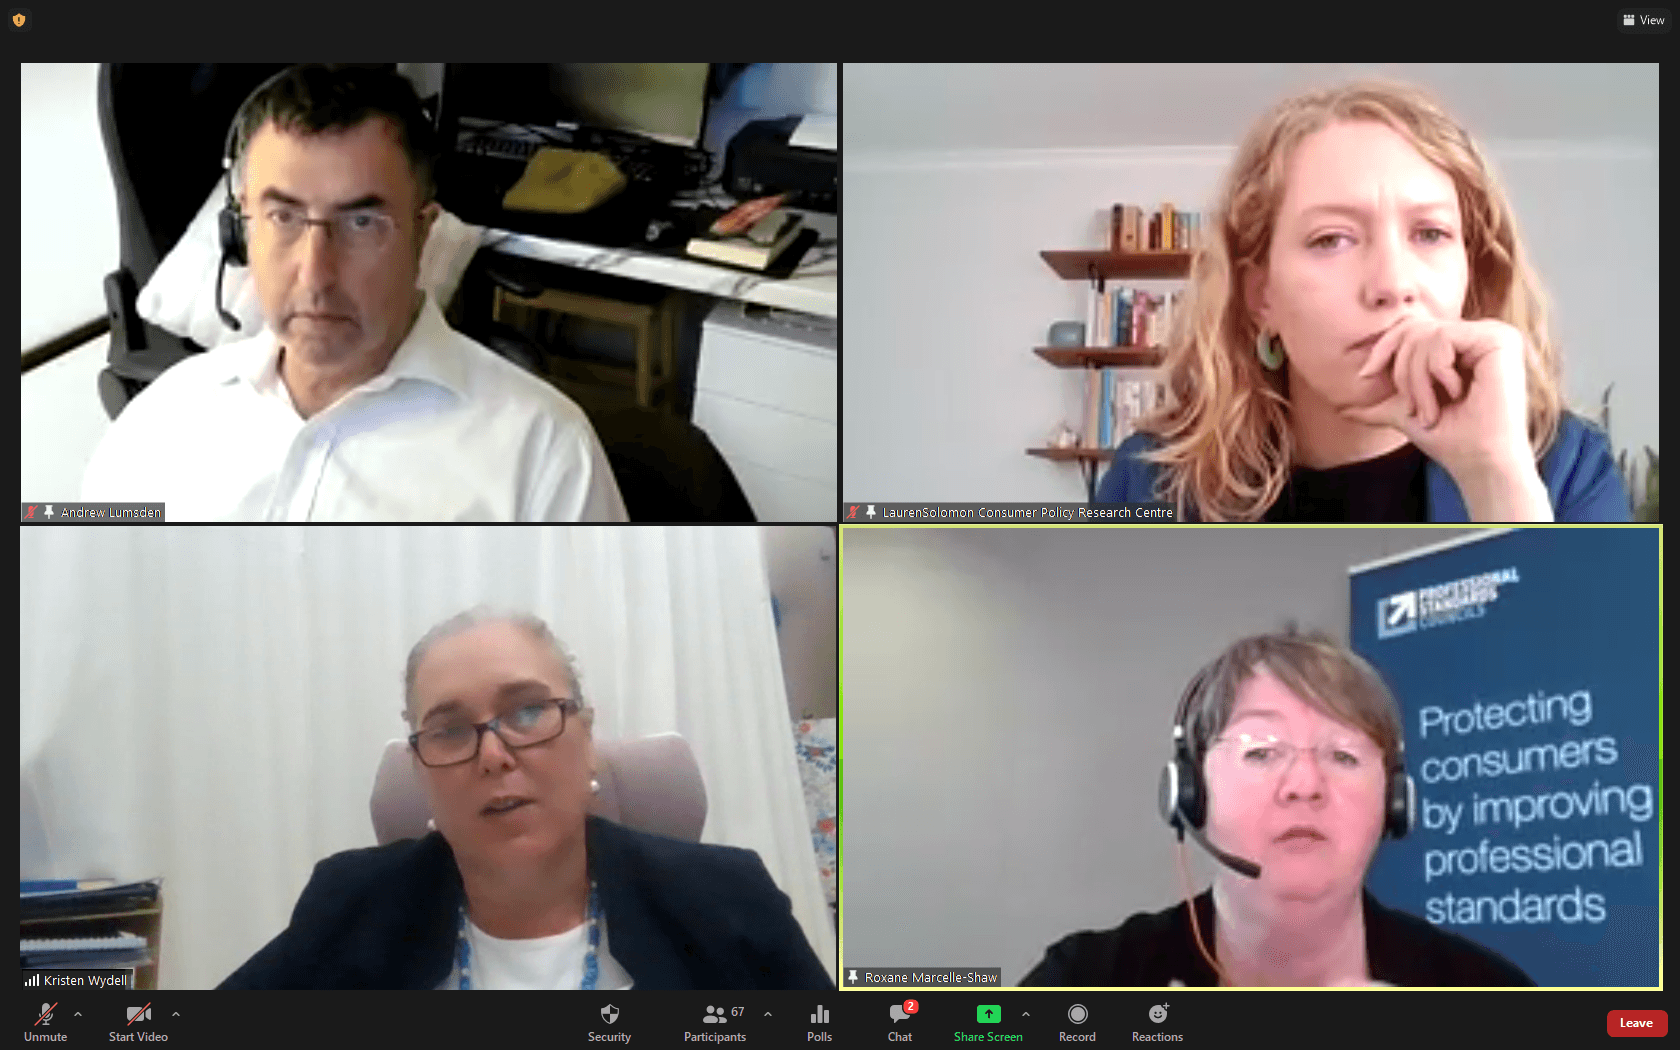
Panel members Andrew Lumsden, Lauren Solomon, Roxane Marcelle-Shaw and Kristen Wydell share in a question and answer session at the April 2021 Professional Standards Forum
Professional Standards Councils' 2020/21 Annual Report Councils work and activities chapter

Read more about this chapter in the Councils' 2020/21 Annual Report

Read more in our annual report